How to
Azure SRE Agent + Grafana MCP: one connector, your whole observability stack
Connect Azure SRE Agent to Grafana through MCP in about twenty minutes. Step by step, with screenshots. After that the agent sees your dashboards, Loki, Prometheus, Tempo and alert rules, and everything else Grafana reaches.
Azure SRE Agent on its own is already a serious product. It reads Log Analytics, queries Azure
Monitor, runs az commands, checks deployment history. Connect it to Grafana through MCP and it
stops being an Azure only tool. It now sees everything Grafana sees.
In 15 years of IT I haven’t seen anything as powerful as this pairing. Here’s what it does and how to set it up. The wiring takes about twenty minutes.
What the agent gets access to
- Grafana dashboards
- Loki logs
- Prometheus and Mimir metrics
- Tempo traces
- Alert rules
- Everything else Grafana already reaches: on-prem datasources via Private Datasource Connect, REST APIs via Infinity, SQL, VictoriaLogs
That last line is the part people miss. The agent isn’t querying your datasources, it’s asking Grafana to. Whatever Grafana reaches, the agent reaches, with one credential and no network path of its own into your datacentre.
What you can do with it
- Root cause analysis across every datasource. Ask why a service is slow and the agent pulls Azure Monitor, Loki and Prometheus for the same window, checks if an alert was already firing, and correlates all of it in one investigation. Not four browser tabs.
- Dashboards via prompt. Describe the panel, following your company’s layout standard, and the agent builds and provisions it.
- Alert management. Create, tune and silence alert rules from a conversation. The agent writes the query, reduce, threshold, labels and annotations; you read and approve.
- Architecture from what the agent actually observes. Not from a Visio file nobody updated.
- FinOps questions answered against real metrics.
- A genuine 100% view of the environment, in one place.
Troubleshooting time drops hard. Implementation time too.
Before you start
- An Azure SRE Agent with the SRE Agent Administrator role (only administrators add connectors).
- A Grafana instance the agent can reach, or a Grafana Cloud stack.
- Permission to create a service account in Grafana.
Nothing gets installed on the Grafana side.
Step 1: create the Grafana token
In Grafana: Administration > Users and access > Service accounts. Add one, then Add service
account token. Copy the glsa_ value, Grafana shows it once.
Give the service account the role that matches what you want the agent to do. Viewer for reading only, Editor if it will build dashboards and alert rules.
One detail: the environment variable name changed, and half the posts out there still use the old one.
# Current
GRAFANA_URL=https://yourstack.grafana.net
GRAFANA_SERVICE_ACCOUNT_TOKEN=glsa_xxxxxxxxxxxx

# Deprecated. Still works, logs a warning, will be removed.
GRAFANA_API_KEY=glsa_xxxxxxxxxxxx
Step 2: add the connector
There’s no Grafana card in the connector gallery. Grafana goes in through the generic MCP path, which takes the same amount of time.
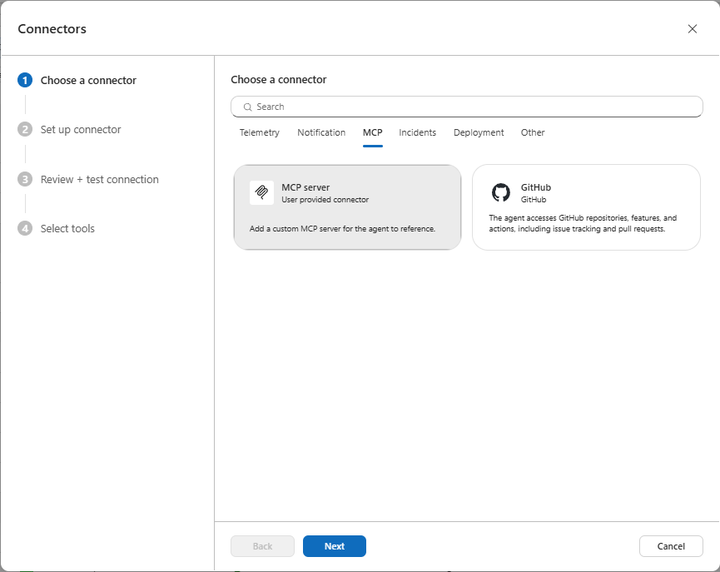
- Open sre.azure.com and your agent.
- Builder > Connectors > Add connector, then the MCP tab, then MCP server (User provided connector).
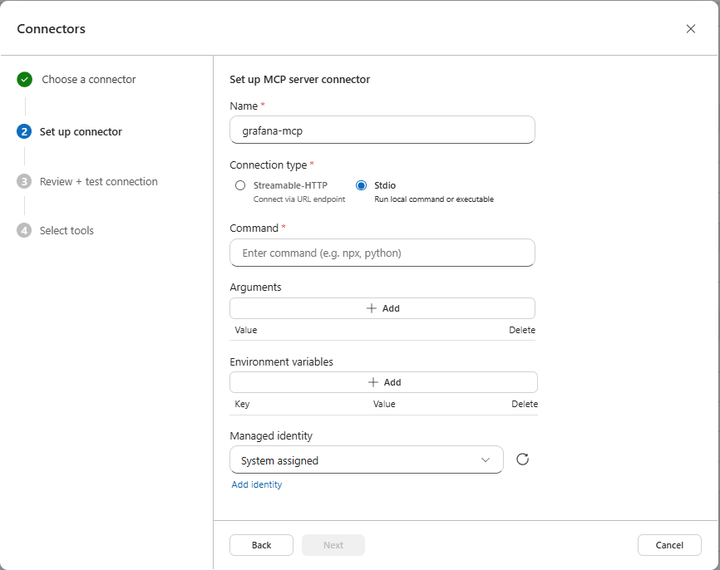
- Name it
mcp-grafana. Keep it short: every tool arrives prefixed with this name, likemcp-grafana_query_loki_logs. - Connection type: Stdio.
- Command:
uvx. Argument:mcp-grafana. One argument per row. - Environment variables:
GRAFANA_URLandGRAFANA_SERVICE_ACCOUNT_TOKENfrom step 1. - Leave Managed identity as is. It’s the agent’s Azure identity, not what talks to Grafana.
- Review + test connection.
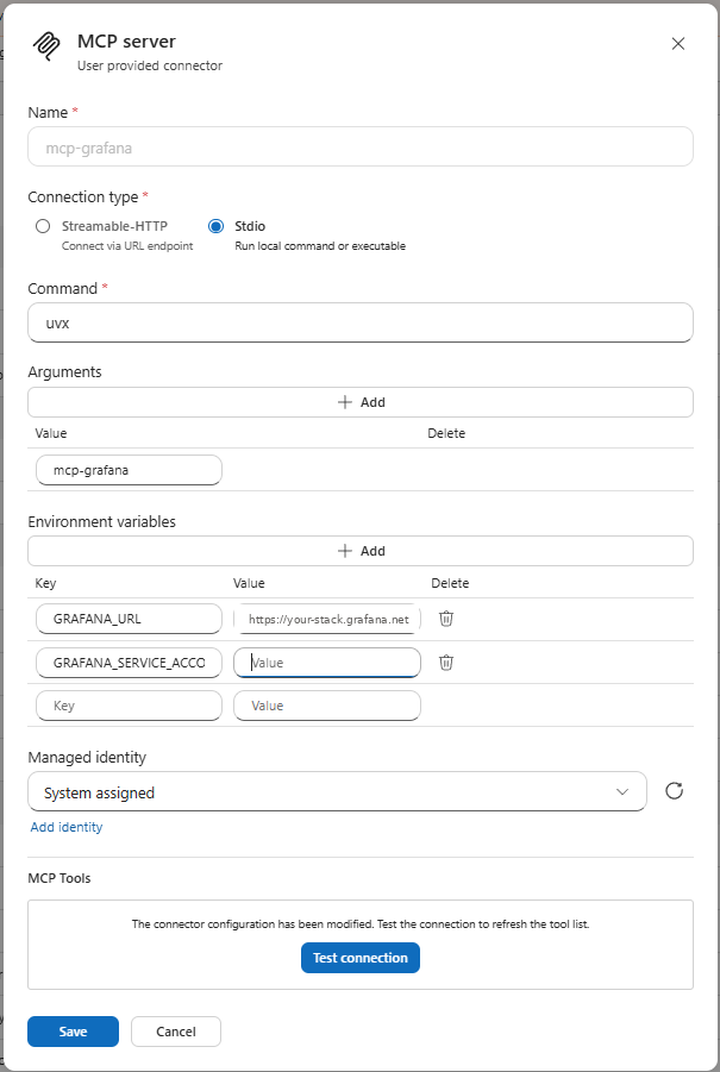
Why uvx? The agent container ships Node.js, Python and .NET, and mcp-grafana is on PyPI, so
uvx mcp-grafana runs it with nothing to install or host. If you’d rather host the server
yourself, pick Streamable-HTTP and point the connector at your URL.
Status goes Initializing, then Connected with a green check. If it stays Failed, it’s the URL, then the token, then the network path, in that order.
Step 3: pick the tools
An SRE Agent can use 80 tools in total, across its own Azure tools and every connector. A
default mcp-grafana connection alone registers around seventy six, so don’t click “select all”.
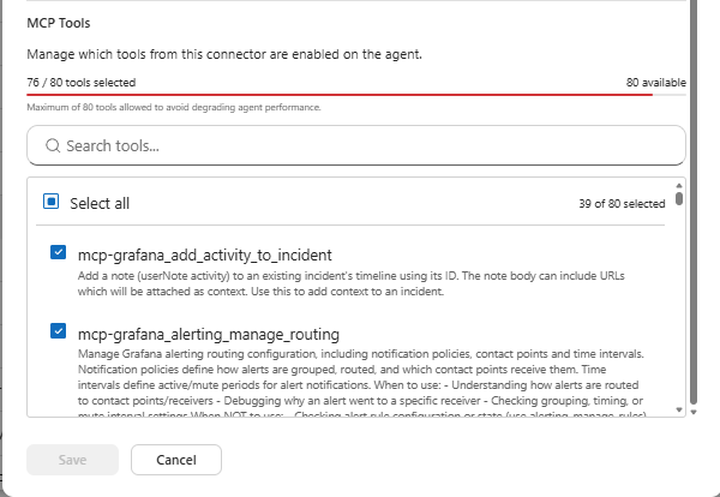
A starting set that covers RCA, dashboards and alerts:
search_dashboards,get_dashboard_summary,get_dashboard_panel_queries,update_dashboardlist_datasources,get_datasourcequery_prometheus,list_prometheus_metric_names,list_prometheus_label_valuesquery_loki_logs,query_loki_stats,list_loki_label_names,list_loki_label_valuesalerting_manage_rules,get_annotations,create_annotationgenerate_deeplink
generate_deeplink is quietly the best of the lot. It gives you a real Grafana URL for the query
the agent just ran, so you can open it yourself.
Want to trim at the source instead of the checkbox list? Add --enabled-tools as an extra
argument on the connector, with the categories you use:
--enabled-tools search,dashboard,datasource,prometheus,loki,alerting,annotations,navigationStep 4: test it
Open a new thread and ask something only Grafana can answer:
List my Grafana datasources and tell me which ones are Loki.Which alert rules are currently firing, and which folder are they in?Search Loki for errors from the last hour and give me a deeplink to the query.Build a dashboard with CPU, memory and disk for the VMs in resource group X, using our standard layout.Each tool call shows as a card with the connection name, the tool name and Completed. No tools in the picker means the connector isn’t Connected. Connected but failing means the tools were never selected for the main agent: edit the connector and check MCP Tools at the bottom.
Step 5: decide who approves what
Under Settings > Permissions you can set, per tool, whether the agent runs it freely, asks first, or never runs it. My split: reads run freely, writes ask.
curl -X PUT "https://<agent>/api/v2/agent/settings/global" \
  -H "Content-Type: application/json" \
  -d '{
    "permissions": {
      "allow": [
        "mcp-grafana_search_dashboards",
        "mcp-grafana_query_prometheus",
        "mcp-grafana_query_loki_logs",
        "mcp-grafana_generate_deeplink"
      ],
      "ask": [
        "mcp-grafana_update_dashboard",
        "mcp-grafana_alerting_manage_rules"
      ]
    }
  }'
That’s it. From here the agent reads your Grafana on its own, builds dashboards and alert rules when you ask, and you press Approve before anything gets written.