How to
Kerberos RC4: collect it with Alloy, watch it with Grafana
A step by step guide to collecting Kerberos telemetry from your domain controllers with Grafana Alloy, shipping it to Loki through Fleet Management, and using a published dashboard to see exactly what RC4 removal is going to break. Including the four things that silently return nothing.
Microsoft is removing RC4 as the default supported encryption type for Active Directory domain controllers, tracked as CVE-2026-20833. The reason is Kerberoasting: an attacker who can request a service ticket encrypted with RC4 can take it away and brute-force the service account’s password offline, at their own pace, with nothing on your network to see.
The rollout ran in three phases. January 2026 added the audit signals. April 2026 made AES the default for accounts with no explicit encryption type, with a rollback still available. The July 2026 update removed audit mode and the rollback, and enforcement is now the only supported configuration. If you are reading this after installing it, RC4 works only where it has been configured explicitly.
The remediation Microsoft documents is a set of PowerShell scripts from the microsoft/Kerberos-Crypto repository. You run one, you get a table, you work down the list:
.\Get-KerbEncryptionUsage.ps1 -Encryption RC4That is a reasonable place to start and a dangerous place to stop, because of one property of the problem the script cannot capture.
A batch job that runs on the first working day of the month. A backup agent that only touches the domain during a full run. A vendor appliance that renews a ticket every ninety days. None of them are in Tuesday’s snapshot. All of them break the day enforcement lands.
RC4 usage is not a state you can read off the directory. It is a behaviour, spread unevenly over weeks, and the only honest way to measure a behaviour is to watch it continuously.
So this is a guide to doing exactly that: turn the events on, collect them with Grafana Alloy, push the config to every domain controller at once with Fleet Management, and read the result on a dashboard you can import. About an hour of work, and then a month of waiting, which is the part that actually matters.
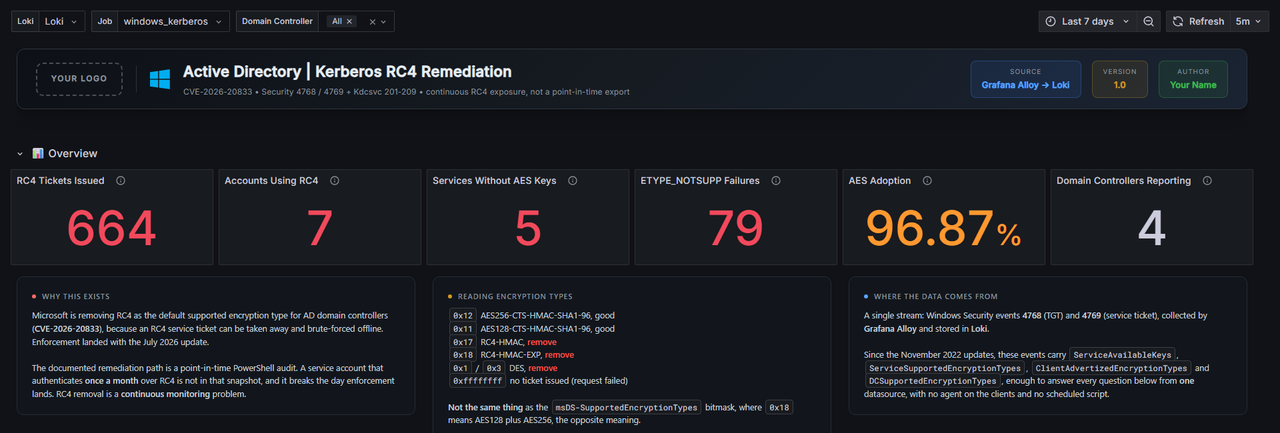
Everything below is published. The dashboard and the collector configs are in igorfasano-tech/grafana-observability, free to take.
What you need before you start
- Domain controllers on Windows Server 2019, 2022 or 2025
- Grafana Alloy 1.14 or later, which you will install on the DCs and nowhere else
- Loki, self-hosted or Grafana Cloud
- Grafana 11 or later
Nothing goes on the clients. There is no scheduled script and no CSV anywhere. Two event streams off the domain controllers answer the whole question.
Step 1: confirm the ticket events are being audited
Kerberos ticket auditing is on by default on a domain controller, under the Default Domain Controllers Policy. Confirm rather than assume:
auditpol /get /subcategory:"Kerberos Authentication Service","Kerberos Service Ticket Operations"You want Success and Failure on both. The Failure half is not optional here: it carries event
4771 and the 0xE results, which are the requests that are already failing today.
If you need to set it explicitly, it lives under Advanced Audit Policy Configuration, Account Logon, in the Default Domain Controllers Policy.
Why these events are enough
Since the November 2022 updates for CVE-2022-37966, a single event 4769 carries considerably more than it used to:
| Field | What it answers |
|---|---|
TicketEncryptionType | What cipher was actually used for this ticket |
ServiceAvailableKeys | Whether the service account holds AES key material at all |
ServiceSupportedEncryptionTypes | The msDS-SupportedEncryptionTypes bitmask on the object |
ClientAdvertizedEncryptionTypes | What the client machine offered |
DCSupportedEncryptionTypes | What the KDC itself advertises |
Status | 0xE when client and service could not agree |
Watch for one trap in that table. As a ticket encryption type, 0x17 is RC4-HMAC and 0x18 is
RC4-HMAC-EXP. In the msDS-SupportedEncryptionTypes bitmask, 0x18 means AES128 plus AES256. The
exact opposite meaning, same number, two fields apart in the same event.
Step 2: turn on the KDC’s own events
The ticket events are the client’s side of the story. The KDC writes its own, and during a migration they are the more useful ones, because they tell you what it is about to refuse. Microsoft added nine, documented in KB5073381:
| Event | What the KDC is telling you | |
|---|---|---|
| 201 | The client advertised only RC4, and the service has no msDS-SupportedEncryptionTypes set | issued |
| 202 | The service account holds no AES keys, and msDS-SupportedEncryptionTypes is not set | issued |
| 203 | Same condition as 201 | blocked |
| 204 | Same condition as 202 | blocked |
| 205 | RC4 explicitly enabled in the domain policy DefaultDomainSupportedEncTypes | |
| 206 | The service accepts only AES, and the client does not advertise AES | issued |
| 207 | The service is configured for AES, but the account holds no AES keys | issued |
| 208 | Same condition as 206 | blocked |
| 209 | Same condition as 207 | blocked |
They come in pairs on purpose. Every blocked event has a warning with the same underlying cause, so a 203 today is a 201 that nobody acted on, and the fix is the same one. The issued column is your remediation backlog and the blocked column is your outage. The entire point of the audit phase is to empty the first before anything lands in the second.
There is no log to switch on. The obvious move is to go looking for a
Microsoft-Windows-Kerberos-Key-Distribution-Center/Operational channel sitting there disabled.
There isn’t one. These go to the System log with the source Kdcsvc, a channel you are
almost certainly already collecting.
The reason you have never seen them is not that the log is off. The KDC only emits them when the RC4 disablement phase is active, and that was a registry value.
Check your patch level before reaching for it. The July 2026 update removed audit mode and this setting with it, so on a fully patched domain controller the phase is decided for you and the value does nothing. If you are past that point, skip to step 3: you will be reading the blocked events rather than the warnings, which means you are debugging rather than preparing, and the collection matters more rather than less.
On a domain controller that still honours it:
$key = 'HKLM:\SYSTEM\CurrentControlSet\Services\Kdc'
New-ItemProperty -Path $key -Name 'RC4DefaultDisablementPhase' -Value 1 -PropertyType DWord -Force
# 0 = no change. RC4 fully permitted, nothing logged.
# 1 = audit. Warnings logged, RC4 still allowed, no behaviour change.
# 2 = enforcement. RC4 blocked for accounts that can do AES.
# The KDC service picks this up on restart.
Set it to 1 and you get the warnings without changing behaviour. That is the whole audit mode, and it is one value.
Step 3: write the collector config
Two source blocks, because they are two different channels, both feeding one processing stage.
// Security channel: the ticket events.
loki.source.windowsevent "kerberos_tickets" {
  eventlog_name = "Security"
  xpath_query   = "*[System[(EventID=4768 or EventID=4769 or EventID=4771)]]"

  bookmark_path          = "C:\\ProgramData\\GrafanaLabs\\Alloy\\data\\bookmark_kerberos.xml"
  poll_interval          = "3s"
  use_incoming_timestamp = true
  locale                 = 1033
  exclude_event_message  = true

  forward_to = [loki.process.kerberos.receiver]
}

// System channel: the KDC's own verdict.
loki.source.windowsevent "kerberos_kdc" {
  eventlog_name = "System"
  xpath_query   = "*[System[(Provider[@Name='Kdcsvc'] or Provider[@Name='Microsoft-Windows-Kerberos-Key-Distribution-Center']) and (EventID=201 or EventID=202 or EventID=203 or EventID=204 or EventID=205 or EventID=206 or EventID=207 or EventID=208 or EventID=209)]]"

  bookmark_path          = "C:\\ProgramData\\GrafanaLabs\\Alloy\\data\\bookmark_kerberos_kdc.xml"
  poll_interval          = "10s"
  use_incoming_timestamp = true
  locale                 = 1033

  forward_to = [loki.process.kerberos.receiver]
}
Five details in there are the difference between this working and this quietly doing nothing.
xpath_query must not repeat the channel name. With eventlog_name set, writing
"Security!*[System[...]]" fails with “The specified query is invalid”. eventlog_name has
already opened the subscription on that channel. Specifying it twice is not idempotent, it is an
error.
exclude_event_message = true, but only on the Security block. The message field is the
rendered English description, and it restates data already present in event_data. On the ticket
events that is free volume. A busy domain controller runs at around 90 MiB an hour for 4768, 4769
and 4771 with the message included, roughly 2 GiB a day from one machine. If you are
shipping to a hosted backend, go and read what your plan actually includes before you point this
at it. A logs plan allowance counted in tens of gigabytes a month disappears under one chatty
domain controller.
On the KDC events, leave the message in. There the message is the payload: it names the account and the service. They are also rare, so there is nothing to save.
The provider name is a trap. Microsoft-Windows-Kerberos-Key-Distribution-Center is a real
ETW provider and reads like the obvious answer. KB5073381 says the source is Kdcsvc, and that is
what appears in the event XML. Filter on the wrong one and you get no error and no events, which
looks exactly like a clean environment. Matching both names costs nothing and survives either
spelling.
Enumerate the event IDs. EventID >= 201 needs XML escaping inside the XPath string. Spelling
out nine numbers avoids the question entirely.
Both blocks forward to the same receiver. One processing stage, one write, one pipeline to manage.
Step 4: promote the three labels the dashboard needs
This is the step people skip, and it is the one that makes every panel read “No data”.
loki.process "kerberos" {
  forward_to = [loki.write.default.receiver]

  stage.json {
    expressions = {
      event_id    = "event_id",
      computer    = "computer",
      channel     = "channel",
      timeCreated = "timeCreated",
    }
  }

  stage.labels {
    values = {
      event_id = null,
      computer = null,
      channel  = null,
    }
  }

  stage.timestamp {
    source           = "timeCreated"
    format           = "2006-01-02T15:04:05.9999999Z07:00"
    fallback_formats = ["2006-01-02T15:04:05Z07:00", "2006-01-02T15:04:05Z"]
  }
}

loki.write "default" {
  endpoint {
    url = "https://logs-prod-XXX.grafana.net/loki/api/v1/push"
    basic_auth {
      username      = "YOUR_LOKI_USER_ID"
      password_file = "C:\\ProgramData\\GrafanaLabs\\Alloy\\gc-token"
    }
  }
  external_labels = {
    job = "windows_kerberos",
  }
}
Two things about that block.
The values must be null, not "". In stage.labels, null means “use the extracted
value”. An empty string is taken as a literal empty label, and {event_id="4768"} then matches
nothing while the data sits in Loki looking perfectly fine.
Do not promote account, service, encryption type or IP address. They are unbounded, and each one multiplies your stream count by the size of your directory. The dashboard parses all of them at query time instead. It is slower per query and dramatically cheaper to run, and it is the reason this collects a whole estate without anybody having a conversation about the bill.
If some other pipeline already ships your System channel, and most Windows fleets have one, those
events arrive with no event_id label at all. A query like {channel="System", event_id=~"20[1-9]"}
matches nothing. The symptom is sum by (event_id) coming back as a single unlabelled series: the
events are in Loki, the pipeline shipping them just never extracted the field. Either add the
label there, or accept that this needs its own pipeline.
Step 5: push it to every domain controller with Fleet Management
Here is where this stops being a lab exercise. A hardening programme is measured across every domain controller you have, and nobody wants to RDP into each one to paste a config block.
Fleet Management inverts the usual agent model. The collector holds almost nothing locally: it registers itself, declares a set of attributes, and asks the server what it should be running. The pipeline lives centrally and you attach it to machines with a matcher rather than a host list.
This is the entire local config on each DC:
remotecfg {
  url            = "https://fleet-management-prod-XXX.grafana.net"
  id             = constants.hostname
  poll_frequency = "60s"

  attributes = {
    "role" = "domain_controller",
    "env"  = "prod",
  }

  basic_auth {
    username = sys.env("FLEET_USER")
    password = sys.env("FLEET_TOKEN")
  }
}
Everything from steps 3 and 4 goes into a pipeline created once, centrally, with a matcher of
role="domain_controller". Promote a new domain controller, give it the attribute, and it starts
reporting Kerberos telemetry without anybody editing a file on it.
Five things to know before you build one.
Pipeline names must be valid Alloy identifiers. Underscores are fine, hyphens are not.
windows_dc_kerberos works; windows-dc-kerberos is rejected with “pipeline name must be valid
alloy identifier”, which is easy to miss if you name things by convention elsewhere.
Updating a pipeline is a full replacement, not a patch. Fetch the current state, change what you need, and send everything back: name, contents, matchers, enabled. Anything you leave out is removed, and dropping a matcher this way takes half the fleet quiet without telling you.
One bad pipeline blocks all the others. Fleet Management merges every matching pipeline into a single config per collector. If one fails to parse, the collector keeps running its last good config and quietly stops picking up changes to all of them. When a pipeline edit appears to do nothing, check whether a different pipeline on the same matcher is broken.
The API request body wraps the object. CreatePipeline and UpdatePipeline both want
{"pipeline": {...}}. Send the fields flat and you get back pipeline is missing, which reads
like you forgot an argument rather than like a shape problem.
Do not put the write token in the pipeline body. Pipeline contents are readable by anyone
holding fleet-management:read, which is a much wider group than the people you would hand a
write token to. Use password_file, as in step 4, and keep the secret on the host. Mind the order
when you switch: put the file on the machine first, confirm it is there, and only then change the
pipeline to point at it. A missing file stops the pipeline building, and see the previous point
for what that does to everything else.
Step 6: check the data actually arrived
Before importing anything, confirm the labels are landing. If these come back empty, no dashboard will save you.
# Should list your job
curl -s "$LOKI/loki/api/v1/label/job/values"

# Should list your domain controllers
curl -s "$LOKI/loki/api/v1/label/computer/values"
Then the one query that proves the parsing works end to end:
sum(
  count_over_time(
    {job="windows_kerberos", event_id=~"4768|4769"}
      |= "TicketEncryptionType"
      | json event_data="event_data"
      | line_format "{{.event_data}}"
      | regexp `<Data Name='TicketEncryptionType'>(?P<etype>[^<]*)</Data>`
      | etype=~"0x17|0x18"
    [7d]
  )
)
That is your RC4 ticket count for the week. If the label queries return data and this returns nothing, read the next section before you start doubting your environment.
The escaping trap that returns nothing
This one is worth the price of the article.
Alloy serialises each event with Go’s encoding/json, which HTML-escapes <, > and & into
\u003c, \u003e and \u0026. The line as stored in Loki does not contain angle brackets at
all. It contains their escape sequences.
So this returns exactly zero results, silently:
{event_id="4769"} |= "TicketEncryptionType'>0x17<"No error. No warning. An empty panel that looks like a clean environment.
The order that works is the one in the query above: filter on a bare field name first, then parse the JSON, then reformat the line, and only then apply a regex containing angle brackets, because by that point the JSON parser has unescaped them.
Step 7: import the dashboard
Grab dashboard.json from
the repository,
import it, and pick your Loki datasource from the dropdown at the top.
The datasource is a dashboard variable rather than an import-time input, so you can point the same
dashboard at a self-hosted Loki and at Grafana Cloud from one browser tab. If you want to publish
your own version to the public grafana.com library, note that its importer is built around an
__inputs block and rejects a datasource variable silently. There is a --grafana-com build flag
in the repository for exactly that.
Leave the range at seven days. A monthly batch account will not show up in the last hour, and finding those is the entire point.
Step 8: read it
The two worklists are not the same job
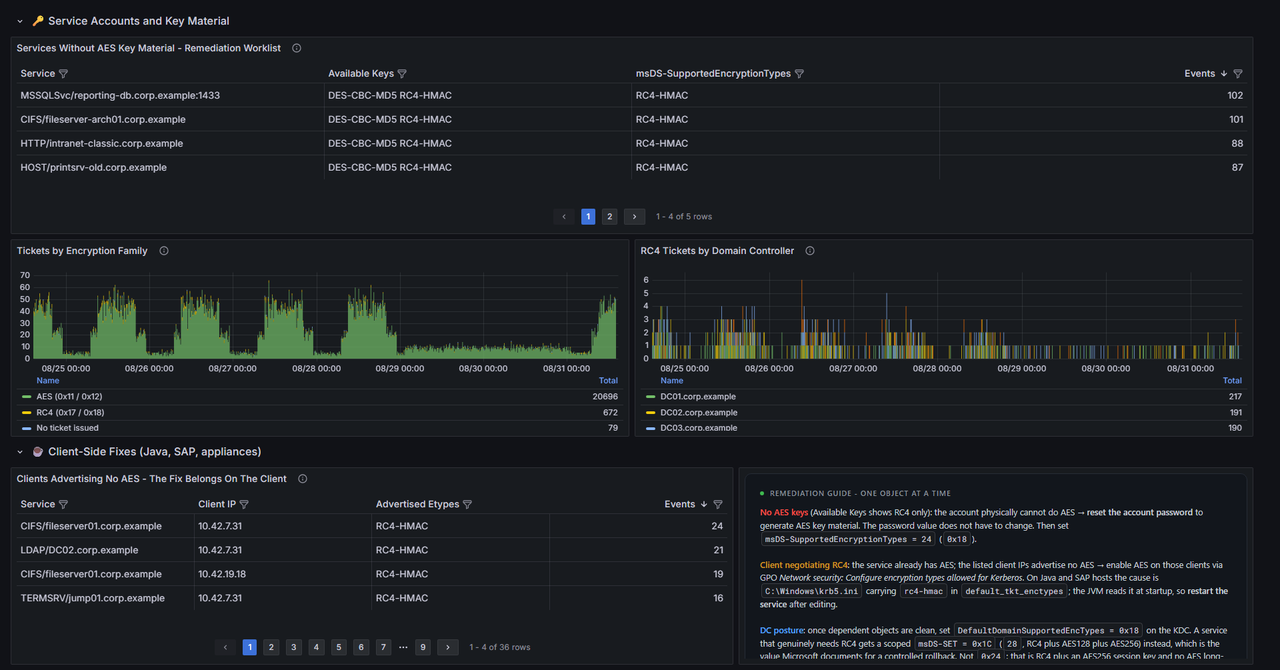
No AES key material. ServiceAvailableKeys with no AES entry means the account physically
cannot negotiate AES, whatever the policy says. The password predates the AES upgrade. The fix is
a password reset, and the value does not have to change, because it is the reset itself that
regenerates the AES keys. Then set msDS-SupportedEncryptionTypes = 24 (0x18, AES128 plus
AES256).
If an account genuinely still needs RC4 for a while, the documented rollback value is 28
(0x1C), which is RC4 plus both AES types. Not 0x24, which looks similar and is RC4 plus an
AES256 session key with no AES long-term keys.
AES available, RC4 advertised. The service is already AES-capable and the negotiation is being
dragged down from the other side. On Java and SAP hosts the usual cause is krb5.ini listing
rc4-hmac in default_tkt_enctypes. The JVM reads that file at startup, so editing it does
nothing until the service restarts.
Two lists, two different teams, two different change windows. Mixing them wastes a lot of people’s time, which is why they are separate panels.
One filter in those queries is worth knowing about. Events where ServiceAvailableKeys is not
applicable carry a literal -, which passes “not empty”, “not N/A” and “contains no AES”. Without
excluding it explicitly, krbtgt and friends show up on the password-reset worklist. False
positives, and the kind that gets somebody to reset twelve service accounts for nothing.
What is already broken
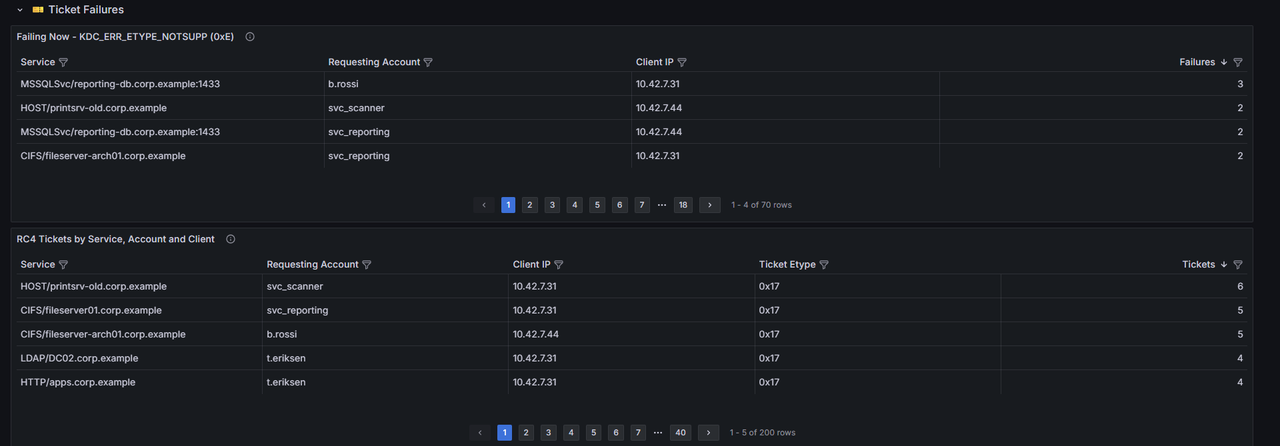
0xE means client and service could not agree. These are broken today, and they are the hardest
to find by any other means. Until the disablement phase is emitting, a 0xE in event 4769 is the
only trace. Most clients then fall back to NTLM, which makes the application look healthy while
silently downgrading the authentication.
Your own domain controllers, and the KDC’s opinion
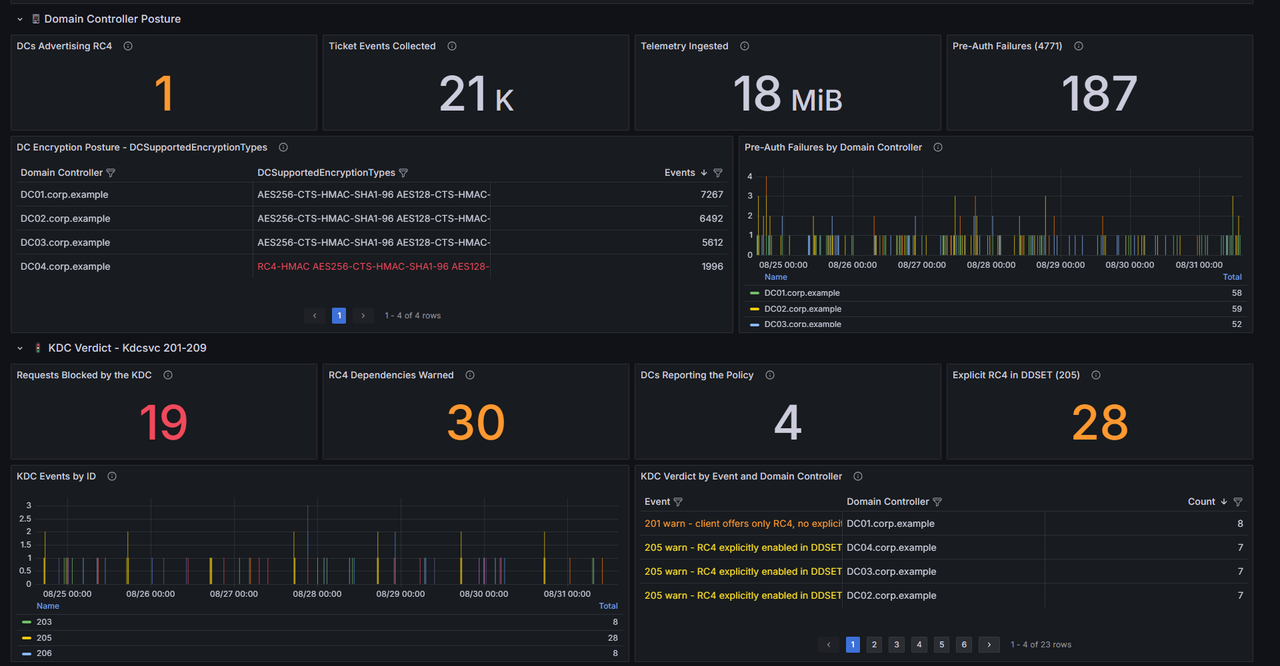
DCSupportedEncryptionTypes is on every ticket event, which means your own domain controllers
report their own posture without you querying anything. It is common to find one that was rebuilt
from an old image, or one site that never got the policy.
The panel worth explaining is DCs Reporting the Policy. A domain controller that emits nothing looks identical to one with nothing to report, and those mean opposite things. If that count is lower than the number of DCs you have, the rest are not clean, they are silent.
That distinction has to survive contact with the panel, and by default it does not. A Grafana stat
with no series takes the base threshold colour, so “Requests Blocked by the KDC” with nothing
behind it renders as a full green tile. It reads as an all-clear and it is the absence of
evidence. The fix is two lines of panel config: a neutral base step with an explicit green step at
zero, so a real zero is green and no data is grey, plus a noValue of “not reporting” instead of
a number that was never there.
That one is invisible in the JSON. It only shows up when the panel is rendered and somebody looks at it, which is the argument for screenshotting a dashboard before you trust it.
Then wait
Turn the collection on well before you plan to enforce anything. Let it run for a full month. Then look at what appeared in week three that was not there on day one.
That gap is the entire value of doing this as a time series rather than a table. A snapshot tells you what was true when you ran it. A time series tells you what is true over the window that matters, and for an authentication protocol that window is at least as long as your slowest scheduled job.
Understand that before you change a policy, and the enforcement day is uneventful. Which is the whole point. Nobody gives you credit for a hardening project that went badly.
To go further
- The dashboard and collector configs on GitHub
- microsoft/Kerberos-Crypto, the official audit scripts
- KB5021131, how to manage the Kerberos protocol changes for CVE-2022-37966
- KB5073381, the RC4 disablement phases and the KDC events 201 to 209
- Detect and remediate RC4 usage in Kerberos
- Grafana Alloy: loki.source.windowsevent reference
- Grafana Fleet Management documentation